
Abstract
Objectives
To characterize and interpret the CT imaging signs of the 2019 novel coronavirus (COVID-19) pneumonia in China.
Materials and methods
The CT images of 130 patients diagnosed as COVID-19 pneumonia from several hospitals in China were collected and their imaging features were analyzed and interpreted in detail.
Results
Among the 130 patients, we can see (1) distribution: 14 cases with unilateral lung disease and 116 cases with bilateral disease, the distribution was mainly lobular core (99 cases) and subpleural (102 cases); (2) number: 9 cases with single lesion, 113 cases with multiple lesions, and 8 cases with diffuse distribution; (3) density: 70 cases of pure ground glass opacity (GGO), and 60 cases of GGO with consolidation; (4) accompanying signs: vascular thickening (100 cases), “parallel pleura sign” (98 cases), “paving stone sign” (100 cases), “halo sign” (18 cases), “reversed halo sign” (6 cases), pleural effusion (2 cases), and pneumonocele (2 cases). After follow-up CT examination on 35 patients, 21 cases turned better and 14 became worse. There were signs of consolidation with marginal contraction, bronchiectasis, subpleural line, or fibrous streak.
Conclusion
GGO and consolidation are the most common CT signs of COVID-19 pneumonia, mainly with lobular distribution and subpleural distribution. The main manifestations were tissue organization and fibrosis at late stage. The most valuable features are the parallel pleura sign and the paving stone sign.
Key Points
• The CT signs of the COVID-19 pneumonia are mainly distributed in the lobular core, subpleural and diffused bilaterally.
• The CT signs include the “parallel pleura sign,” “paving stone sign,” “halo sign,” and “reversed halo sign.”
• During the follow-up, the distribution of lobular core, the fusion of lesions, and the organization changes at late stage will appear.
Introduction
In December 2019, a series of pneumonia cases outbreak in Wuhan City, Hubei Province, China, showing that it was a new type of coronavirus, which was termed the 2019 novel coronavirus (COVID-19) [1, 2]. The virus can cause pneumonia named “novel coronavirus pneumonia (NCP).” So far, cases have been confirmed all over the world, including Asia, Europe, America, Oceania, and Africa [3]. Until April 12th, the number of COVID-19 cases confirmed globally has increased to 1,696,588, of which 105,952 have died. Among them, the number of confirmed cases in Europe has risen to 880,106, of which 74,237 have died [4].
The COVID-19 has been confirmed to spread from person to person, mainly transmitting through respiratory secretions or direct contact. At present, the diagnosis of COVID-19 pneumonia is based on clinical symptoms, contact history of epidemic area, imaging diagnosis, and nucleic acid detection. However, false negative in nucleic acid detection has been reported, and the clinical symptoms may be atypical that may cause misdiagnosis and make the situation spread. Therefore, the imaging examination becomes particularly important. In this study, the CT images of 130 patients diagnosed as COVID-19 pneumonia were collected and their imaging features were analyzed. The NCP was classified for the first time according to its distribution characteristics and the CT signs were further interpreted from the perspectives of anatomy, pathophysiology, and immunity, in order to improve the radiologists’ familiarity with the disease and help make the early diagnosis and show insights in the development of disease on follow-up CT.
Materials and methods
The Ethics of Committees of Qujiang District People’s Hospital approved this retrospective study, which waived the requirement for patients’ informed consent. A total of 130 cases were collected from five hospitals in China from January 24, 2020, to February 17, 2020, with a positive COVID-19 nucleic acid antibody. All the patients underwent thin-slice CT scan. All CT examinations were performed with a 128-section scanner (Siemens, GE, Neusoft) without injecting contrast media. All thin-slice CT images were uploaded through the network and reviewed by three chest radiologists (J.W., J.P., and D.T.) with approximately 5 to 30 years of experience in chest imaging. In cases of discrepant assessment results between the radiologists, images were reviewed independently, and a consensus was established. When radiologists disagreed about a sign, a consensus meeting online was held. The radiation dose for CT scan is 120 kV/30 mA/142 mAs/454.7 mGy·cm.
CT signs were categorized before reviewing cases, including distribution (unilateral/bilateral lung), number (single/multiple), density (ground-glass shadow (GGO)/consolidation) and parallel pleura sign (subpleural distribution and long axis parallel to the pleura), bronchial sign (air-bronchogram and bronchiectasis), vascular sign, “halo sign,” “reversed halo sign,” and pleural effusion.
Results
Of the 130 patients, 78 (60%) were male and 52 (40%) were female. The average age of onset was 42.9 ± 15.0. Common symptoms at onset of illness were fever (106 (81.5%) of 130 patients), cough (68 (52.3%)), and myalgia/fatigue (19 (14.6%)); less common symptoms were sore throat (11(8.5%) of 130 patients), diarrhea (8 (6.2%)), and headache (3 (2.3%)). Meanwhile, 85 (65%) of 130 patients had lymphopenia. Six patients received mechanical ventilation, accounting for 4.6%.
CT examination for the first time was performed within the range of 1 to 20 days after symptoms, with an average of 5.5 days. A total of 35 patients underwent follow-up CT. Among them, CT examinations were performed for each patient twice to five times, with an average of 2.8 times. And the first follow-up time ranged from 3 to 27 days after admission, with an average of 7 days.
Fifty-two patients showed false negatives of the nucleic acid test for the first time, accounting for 40%. That is, the positive rate of nucleic acid test is 60% for the first time.
CT signs of the initial chest CT scan (see Table 1)
Distribution
There were 14 cases (10.7%) with unilateral lung disease and 116 cases (89.3%) with bilateral lung disease. The NCP was classified for the first time according to the imaging distribution: there were 99 cases (76.1%) of lobular distribution (Fig. 1a), 102 cases (78.4%) of subpleural distribution (Fig. 1b), and 8 cases (6.1%) of diffuse distribution (Fig. 1c). These types can overlap in one patient.

The diagram and CT images of the NCP classified according to its imaging distribution. a Lobular distribution, (b) subpleural distribution, and (c) diffuse distribution
Number
There were 9 cases (6.9%) with single GGO, 113 cases (86.9%) with multifocal GGOs, and 8 cases (6.1%) with diffuse lesions.
Density
There were 70 cases (53.8%) with GGO and 60 cases (46.2%) with GGO and consolidation; moreover, the consolidation was found in 53 cases (40.7%) with straight edge and 23 cases (17.7%) with contracted edge. Straight edge means that the edge of the lesion is a straight line instead of bulging. The tumor often swells due to the space effect, and the inflammation is usually straight. Contracted edge means that the center is concave toward the lesion, suggesting internal fibrous hyperplasia pulling the edge inward, which is the manifestation in the inflammatory repair period.
Other accompanying signs
-
1)
“Parallel pleura sign” is an important sign of NCP, which is proposed for the first time in this study. There were 98 cases (75.3%) with “parallel pleura sign” (Fig. 2a).
-
2)
“Paving stone sign” was observed in 100 cases (76.9%), referring to the thickening of interlobular septum (Fig. 2b).
-
3)
Air-bronchogram was found in 100 cases (76.9%) and bronchiectasis was found in 52 cases (40%) (Fig. 2c).
-
4)
“Vascular sign”: vascular thickening was found in 100 cases (76.9%) (Fig. 2d).
-
5)
“Halo sign” and “reversed halo sign”: “halo sign” refers to the ground-glass shadow around the mass or nodule (18 cases, 13.8%) (Fig. 2e). The “reversed halo sign” is characterized by focal, round, or half-moon shape with ground-glass density in the center, and completely or basically completely (more than 3/4) surrounded by high-density consolidation shadow. There were 6 cases (4.6%) with “reversed halo sign” (Fig. 2f).
-
6)
In this study, 2 cases (1.5%) had pleural effusion and 2 cases (1.5%) had pneumonocele. No pulmonary cavity was found in all cases.
Fig. 2 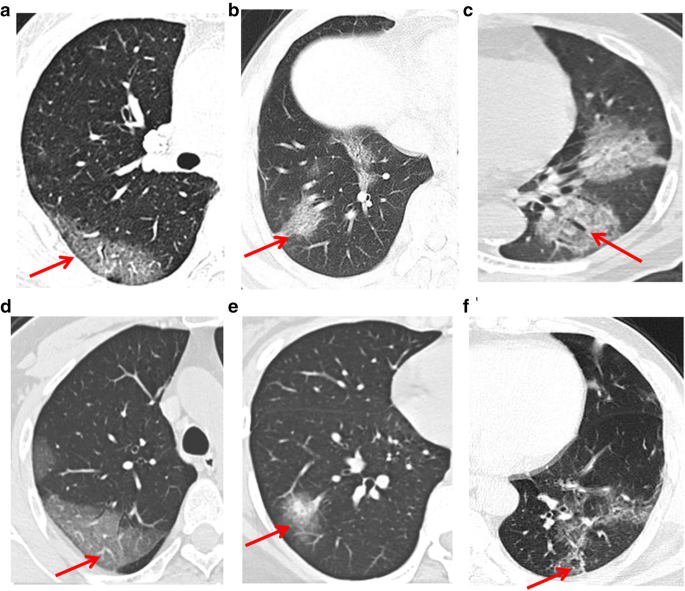
CT signs (red arrow). a “Parallel pleura sign,” b “Paving stone sign,” c Bronchiectasis, d “Vascular sign,” e “Halo sign,” f “Reversed halo sign”

CT signs of the follow-up chest CT scan
Thirty-five patients underwent follow-up chest CT scan for twice to five times. The initial scan and the last scan were compared. Among them, 21 patients (60%) turned better, and the follow-up CT manifestations were shown as follows (Fig. 2): (1) The area and the number of GGO or consolidation decreased in 21 cases (60%); (2) the density of GGO increased and changed into consolidation in 22 cases (62.8%); (3) the edge of consolidation shadow became contracted in 20 cases (57.1%); (4) there were fibrous streaks or subpleural line in 14 cases (32.6%). However, 13 cases (37.1%) showed dynamic CT imaging signs; that is, some lesions were getting better while some other lesions became enlarged or some new lesions appeared. Among the 35 patients, 14 patients (40%) became aggravated, showing that the area and number of the GGO increased and the lesions had a tendency of fusing. In addition, 8 cases (22.9%) showed “white lung” changes in bilateral lungs (Fig. 3, Fig. 4).

One patient with positive COVID-19 nucleic acid antibody had chest CT examination for five times. a Initial CT scan (day 1) showed multiple GGOs and lobular distribution. b The lesion became enlarged and the lobular distribution was more obvious, namely the “paving stone sign” (day 3). c, d CT showed the distribution of ground glass shadow in the lobular core (day 4). e, f CT manifestations turned more severe with further expansion of the area and fusion trend. The “parallel pleura sign” can be seen (day 6). g, h After treatment, GGO absorption, consolidation, marginal contraction, and bronchiectasis can be seen, indicating the formation of organization and the improvement of lesions (day 9)
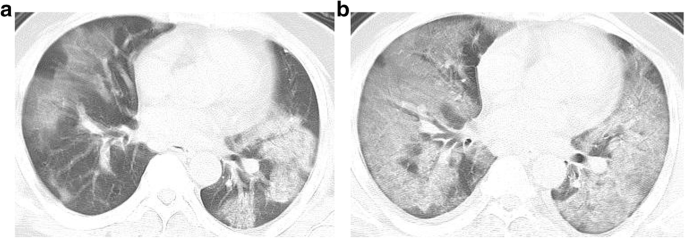
Another patient with positive COVID-19 nucleic acid antibody had chest CT examination twice in the same CT section. a The initial CT scan showed the patchy ground-glass density with lobular distribution and fusion trend, namely the “parallel pleura sign” and “paving stone sign”; b 2 days later, the CT manifestations progressed into diffuse ground-glass shadow in both lungs (“white lung”)
Discussion
This is the first study to classify the NCP according to the CT imaging distribution with a relatively larger sample than previous case reports or researches [5,6,7,8,9,10]. The CT examination was performed and the CT signs were analyzed within 1 to 20 days after symptoms. Moreover, the follow-up CT examination was performed at the time of 3 to 27 days after admission. The initial and follow-up chest CT signs were shown as follows.
Common CT signs of the NCP
Distribution
It includes lobular distribution, subpleural distribution, diffuse distribution, and mixed type. The virus particles are small. After inhaling the virus into the airway, the large airway is seldom invaded by the virus due to its abundant cilia and strong immune function. The virus mainly invades bronchioles, causing bronchiolitis and peripheral inflammation, and then spreads and invades the lung tissue. On CT image, the early manifestation shows GGO density. The virus mainly invades lung interstitium, conforming to the previous literature [11]. In all cases, we did not see obvious thickening of the bronchovascular bundle and the pleura, so we speculated that the main lung interstitium invaded by the virus was the lobular interstitium. Therefore, the image distribution is mainly classified as follows:
-
1)
Lobular distribution: when the virus causes inflammation in the lobular core, it is easy to form globular GGO, and then quickly diffuses to the surrounding area, forming larger globular GGO or patches of lobular distribution. In follow-up CT images, the lesions expanded to the surrounding area, and the distribution was mostly seen in lung outer zone or in the whole lung; the adjacent lesions can fuse during progression. This is one of the most common distribution patterns of the NCP, that is, nodular or patchy GGO distributed in the lobular core and fused finally.
-
2)
Subpleural distribution: due to the better development of pulmonary lobules in peripheral subpleural region with rich blood flow and lymph, the inflammatory response of lung lobular interstitium is more severe. The NCP mainly invades the bronchioles and distal lung tissue, causing inflammatory lesions mainly in the interstitium; thus, the distribution is mainly in the peripheral subpleural region, which is also one of the most common distribution patterns.
-
3)
Diffuse distribution: the lobular distribution and subpleural distribution can overlap. Meanwhile, they progress and merge into a large high-density shadow, which can affect most areas of the bilateral whole lung, that is, diffuse distribution.
Number
The lesions are often multiple; some of them are single (at very early stage) and turn into multiple at follow-up. Multiple lesions can develop and fuse rapidly. Although the single case is rare, it is easy to be misdiagnosed, which needs more attention and follow-up.
Density
There are three kinds of density: (1) GGO, (2) consolidation, and (3) GGO + consolidation. We think that marginal fuzzy GGO often appears at the early stage because of the obvious inflammatory exudation; when the exudation turns into the proliferation, fuzzy GGO will become clear GGO, then the consolidation appears with straight edge, which is similar to acute respiratory distress syndrome (ARDS) from the exudative phase to the proliferative phase. At the late stage, the repair was accompanied by the formation of organization, and the contracted edge appears in the consolidation with the fiber traction and bronchiectasis. The contracted edge indicates the recovery of the lesion.
Other accompanying signs
“Parallel pleura sign”
This CT sign is reported for the first time in the current study, which needs two conditions: the first is the subpleural distribution; the second is that the maximum diameter of the lesion is parallel to the pleura. Its formation mechanism may be as follows: When the virus mainly invades the interlobular interstitium, especially the perialveolar interstitium, this part of lymph drainage direction is subpleural and interlobular septum. The lesion will spread to the pleural side and bilateral interlobular septum. Since the distal end is limited by the pleura, the lesion can only cling to the pleura, spread along the reticular structure of the interlobular septum, and diffuse to the periphery. The fusion with subpleural lesions leads to the long axis of the lesions parallel to the pleura. The “parallel pleura sign” is very characteristic in NCP but is not specific; it can be present in other interstitial lung diseases such as influenza pneumonia.
“Paving stone sign”
The “paving stone sign” is an important sign of the NCP, indicating that the virus is mainly involved in the interlobular septum, consistent with the other viral pneumonia, such as severe acute respiratory syndrome (SARS) [12, 13] and Middle East respiratory syndrome (MERS) [14]. However, this sign was nonspecific with other viral pneumonia.
SARS and MERS progress faster than COVID-19 with a longer incubation period, and therefore have higher infectiousness and more asymptomatic infections. They have similar CT manifestations as peripheral multifocal airspace opacities (GGO, consolidation, or both). In addition, the prognosis of COVID-19 is better with milder symptom and fewer lung fibrosis compared with SARS and MER [15].
Air bronchogram and bronchiectasis
The air bronchogram could be observed and no bronchial obstruction was found, due to the fact that the virus is mainly involved in lung interstitium and there was little exudation in the alveoli. Moreover, in all cases, there was no obvious thickening of the bronchial wall. One case had “tree-bud sign,” which can appear at the early stage of viral pneumonia [11], but we think that “tree-bud sign” is not a typical imaging manifestation of the NCP. Bronchiectasis can be found at the later stage, often accompanied by marginal contraction, suggesting that the lesion is at the repair stage caused by fiber traction. Air bronchogram is not specific to COVID-19, but it helps distinguish the virus from other bacterial pneumonia. Bronchiectasis is also very common and not specific to COVID-19, but it helps indicate the progress of the disease.
Vascular sign
Thickening vessels can appear in the lesions, which is consistent with the general rule of inflammation. The inflammation may cause increased vascular permeability, telangiectasia, and relevant pulmonary artery thickening. We think that this sign is not specific to distinguish virus from other inflammatory diseases.
“Halo sign” and “reversed halo sign”
The “halo sign” refers to the ground-glass shadow around the mass or nodule, which can be the change of bleeding around the lesion, or the spread of the lesion to the surrounding interstitium. This sign has been reported in fungi, vasculitis, and some viruses, the most common one is herpes virus [11], and can also be found in COVID-19. On the contrary, the “reversed halo sign” is focal, round, or half-moon shaped, with a GGO area in the center and completely or more than 3/4 surrounded by high-density consolidation, which was first reported in the cryptogenic organizing pneumonia (COP) [16]. This sign can be present in many other diseases such as COP, tuberculosis, vasculitis, lung cancer, and metastasis. The NCP also presented a reversed halo sign. We suggest that the main inflammatory repair is the edge of the lesions, leading to the result that the formation of the edge tends to solid strip shadow while the central repair is relatively delayed.
Follow-up CT changes
Among 35 follow-up cases, the CT manifestations in 20 cases who turned better were mainly shown as follows: (1) The area and the number of GGO or consolidation decreased; (2) the density of GGO increased and turned into consolidation; (3) the edge of consolidation became straight, even contracted or retracted; (4) there were fiber strips or subpleural line. We hypothesize that the development of the GGO into consolidation may be due to secondary alveolar pulmonary edema, and tissue organization, and partly combined with bacterial infection. In addition, the absorption of GGO, consolidation, edge contraction and retraction, fiber strips or subpleural line, and bronchiectasis all indicate the organization changes. Both GGO and consolidation exist in the transitional period. In addition, some cases showed dynamic CT signs; that is, some lesions got better while the other lesions became enlarged or new lesions appeared. This may be due to the delayed inflammatory response or organization in part of the lung tissue. Of the 35 patients, 14 patients became aggravated, mainly manifesting in the increased lesion area and number, and the tendency of fusion. In addition, there were 8 cases of “white lung” changes in diffuse whole lung, which had a high mortality rate.
The limitations in the current study must be acknowledged. This study was performed at a stage that was not sufficiently familiar with the disease. Because of the panic for unknown disease, follow-up CT examinations were too frequent and may cause harm to patients. Although CT examination is helpful for early diagnosis, but follow-up CT is not necessary and even should be avoided especially for patients with mild symptom. Moreover, we used conventional radiation doses for CT scans and low-dose scans should be performed during follow-up CT examinations.
In summary, the CT signs of the NCP have some characteristics. It is mainly distributed in the lobular core, subpleural and diffused bilaterally, including the “parallel pleura sign,” “paving stone sign,” and “reversed halo sign”. The NCP was classified according to the distribution characteristics and “parallel pleura sign” was raised for the first time in this study. During the follow-up, the distribution of lobular core, the fusion of lesions, and the organization changes at late stage will appear. It has been reported that patients with positive chest CT findings may present with false negative results of nucleic acid examination for COVID-19 [17, 18]. Therefore, patients with negative nucleic acid results but highly suspicious CT signs should also be isolated in time. Furthermore, follow-up X-ray or CT examinations are necessary in a short period of time, and those with highly suspicious clinical and radiological manifestations should have multiple nucleic acid tests.
Abbreviations
- ARDS:
-
Acute respiratory distress syndrome
- COP:
-
Cryptogenic organizing pneumonia
- COVID-19:
-
2019 novel coronavirus
- GGO:
-
Ground-glass opacity
- MERS:
-
Middle East respiratory syndrome
- NCP:
-
Novel coronavirus pneumonia
- SARS:
-
Severe acute respiratory syndrome
References
Huang C, Wang Y, Li X et al (2020) Clinical features of patients infected with 2019 novel coronavirus in Wuhan, China. Lancet 395(10223):497–506
Li Q, Guan X, Wu P et al (2020) Early transmission dynamics in Wuhan, China, of novel coronavirus–infected pneumonia. N Engl J Med 382(13):1199–1207
Velavan TP, Meyer CG (2020) The COVID-19 epidemic. Trop Med Int Health 25(3):278–280
World Health Organization (April 12, 2020) Coronavirus disease 2019 (COVID-19). Situation report-83. Geneva, Switzerland: World Health Organization; 2020 https://www.who.int/docs/default-source/coronaviruse/situation-reports/20200412-sitrep-83-covid-19.pdf?sfvrsn=697ce98d_4
Song F, Shi N, Shan F et al (2020) Emerging coronavirus 2019-nCoV pneumonia. Radiology 295(1):210–217
Fang Y, Zhang H, Xu Y, Xie J, Pang P, Ji W (2020) CT manifestations of two cases of 2019 novel coronavirus (2019-nCoV) pneumonia. Radiology 295(1):208–209
Shi H, Han X, Zheng C (2020) Evolution of CT manifestations in a patient recovered from 2019 novel coronavirus (2019-nCoV) pneumonia in Wuhan, China. Radiology 295(1):20
Chung M, Bernheim A, Mei X et al (2020) CT imaging features of 2019 novel coronavirus (2019-nCoV). Radiology 295(1):202–207
Lei J, Li J, Li X, Qi X (2020) CT imaging of the 2019 novel coronavirus (2019-nCoV) pneumonia. Radiology 295(1):18
Pan Y, Guan H, Zhou S et al (2020) Initial CT findings and temporal changes in patients with the novel coronavirus pneumonia (2019-nCoV): a study of 63 patients in Wuhan, China. Eur Radiol. https://doi.org/10.1007/s00330-020-06731-x
Koo HJ, Lim S, Choe J, Choi S-H, Sung H, Do K-H (2018) Radiographic and CT features of viral pneumonia. Radiographics 38:719–739
Ooi GC, Khong PL, Müller NL et al (2004) Severe acute respiratory syndrome: temporal lung changes at thin-section CT in 30 patients. Radiology 230:836–844
Paul NS, Roberts H, Butany J et al (2004) Radiologic pattern of disease in patients with severe acute respiratory syndrome: the Toronto experience. Radiographics 24:553–563
Ajlan AM, Ahyad RA, Jamjoom LG, Alharthy A, Madani TA (2014) Middle East respiratory syndrome coronavirus (MERS-CoV) infection: chest CT findings. AJR Am J Roentgenol 203:782–787
Hosseiny M, Kooraki S, Gholamrezanezhad A, Reddy S, Myers L (2020) Radiology perspective of coronavirus disease 2019 (COVID-19): lessons from severe acute respiratory syndrome and Middle East respiratory syndrome. AJR Am J Roentgenol 1–5. https://doi.org/10.2214/AJR.20.22969
Kim SJ, Lee KS, Ryu YH et al (2003) Reversed halo sign on high-resolution CT of cryptogenic organizing pneumonia: diagnostic implications. AJR Am J Roentgenol 180:1251–1254
Kanne JP (2020) Chest CT findings in 2019 novel coronavirus (2019-nCoV) infections from Wuhan, China: key points for the radiologist. Radiology 295(1):16–17
Xie X, Zhong Z, Zhao W, Zheng C, Wang F, Liu J (2020) Chest CT for typical 2019-nCoV pneumonia: relationship to negative RT-PCR testing. Radiology. https://doi.org/10.1148/radiol.2020200343:200343
Funding
This work has not received any funding.
Author information
Authors and Affiliations
Corresponding author
Ethics declarations
Guarantor
The scientific guarantor of this publication is Dr. Yu-Chen Chen.
Conflict of interest
The authors of this manuscript declare no relationships with any companies, whose products or services may be related to the subject matter of the article.
Statistics and biometry
No complex statistical methods were necessary for this paper.
Informed consent
The Institutional Review Board waived the requirement for patients’ informed consent.
Ethical approval
Institutional Review Board approval was obtained. The Ethics of Committees of Qujiang District People’s Hospital approved this retrospective study.
Methodology
• retrospective
• cross sectional study
• multicenter study
Additional information
Publisher’s note
Springer Nature remains neutral with regard to jurisdictional claims in published maps and institutional affiliations.
Rights and permissions
About this article

Cite this article
Wu, J., Pan, J., Teng, D. et al. Interpretation of CT signs of 2019 novel coronavirus (COVID-19) pneumonia. Eur Radiol 30, 5455–5462 (2020). https://doi.org/10.1007/s00330-020-06915-5
Received:
Revised:
Accepted:
Published:
Issue Date:
DOI: https://doi.org/10.1007/s00330-020-06915-5