Running Head: COPD Morbidity and Mortality in the United States
Funding Support: The COPD Foundation received grants from Boehringer Ingelheim and AstraZeneca for partial support of this work.
Date of Acceptance: October 2, 2018
Abbreviations: chronic obstructive pulmonary disease, COPD; Behavioral Risk Factor Surveillance System, BRFSS; emergency department, ED; Center for Disease Control and Prevention, CDC; coronary heart disease, CHD; myocardial infarction, MI; cardiovascular diseases, CVDs; Wide-ranging Online Data for Epidemiologic Research, WONDER; International Classification for Disease-10th revision, ICD-10; chronic disease indicators, CDI; Centers for Medicare and Medicaid, CMS; pulmonary rehabilitation, PR; age-adjusted prevalence, AAP
Citation: Sullivan J, Pravosud V, Mannino DM, Siegel K, Choate R, Sullivan T. National and state estimates of COPD morbidity and mortality — United States, 2014-2015. Chronic Obstr Pulm Dis. 2018; 5(4): 324-333. doi: http://doi.org/10.15326/jcopdf.5.4.2018.0157
Online Supplemental Material: Read Online Supplemental Material (1788KB)
Background
Chronic obstructive pulmonary disease (COPD) includes emphysema and chronic bronchitis. COPD is the major component of chronic lower respiratory diseases, which is the fourth leading cause of death in the United States.1 The burden of COPD has continued to rise over the last several decades, especially in select populations such as women and in rural areas.2,3
In 2010, among adults 25 years and older, there were 699,000 (age-adjusted rate of 32.2 per 10,000) estimated hospitalizations for COPD as the first-listed discharge diagnosis, as well as 1,468,000 (age-adjusted rate of 72.0 per 10,000) emergency department (ED) visits for COPD, and 10,291,000 (age-adjusted rate of 494.8 per 10,000) physician office visits.3
The economic costs attributable to COPD in 2010 were estimated to be $32.1 billion and are projected to increase to $49.0 billion by 2020.4 Moreover, 16.4 million days of work lost because of COPD, resulting in $3.9 billion total absenteeism costs, were estimated in 2010.4
Until recently, relatively little data existed to document the burden of COPD at a state level. In 2011, a COPD question was added to the Behavioral Risk Factor Surveillance System (BRFSS), producing state level prevalence estimates, and since this time, various other chronic disease databases have grown to include COPD state level information. The COPD Foundation undertook the “COPD in the States” project to analyze and gather state level data into a single location to identify how the burden differs across states and regions, and to provide policy and public health decision makers with information to guide a response to COPD.
Data Sources and Methods
COPD Morbidity
The BRFSS for 2014-2015 was used to provide national and state estimates of the prevalence of COPD5 State health departments, in collaboration with the Centers for Disease Control and Prevention (CDC) finalized a study sample of noninstitutionalized U.S. residents who are 18 years or older to conduct both landline telephone- and cellular telephone-based surveys.6,7 The median response rate in 2014 for all states, territories and the District of Columbia was 47% ranging from 25.1% to 60.1% .8 In 2015, the median response rate for all states, territories and the District of Columbia was 47.2%, and ranged from 33.9% to 61.1%.9
All calculations were carried out using SAS, version 9.4 (SAS Institute Inc., Cary, North Carolina). We analyzed information from a total of 906,120 survey participants aged 18 years and older. Positive responses to the question: “Ever told you have chronic obstructive pulmonary disease or COPD, emphysema or chronic bronchitis?” were used to calculate COPD morbidity in each state and the United States overall. Both crude and age-standardized percentages of prevalence of COPD were calculated. Age-adjusted percentages were standardized using the direct method to the year 2000 projected Census population using 6 age groups: 18-24 years, 25–34 years, 35–44 years, 45–54 years, 55–64 years, and ≥65 years.
BRFSS data for the years of 2014 and 2015 were also used to provide estimates of COPD prevalence for different age, sex, income, and race groups. The survey participants were divided into 6 age groups (18-24 years, 25–34 years, 35–44 years, 45–54 years, 55–64 years, and ≥65 years), 2 sex groups (men and women), 5 income categories (less than $15,000, from $15,000 to less than $25,000, from $25,000 to less than $35,000, from $35,000 to less than $50,000, and equal to or greater than $50,000), and 3 major race groups (white, non-Hispanic; black, non-Hispanic; and Hispanic).
Moreover, 2014-2015 BRFSS data provided the information on cigarette smoking which we used to estimate the number of current smokers as well as the crude and the age-adjusted percentages of people who were current smokers.
There are some limitations to the data gathered from the BRFSS. The BRFSS is a self-reported survey, raising the possibility that the prevalence of physician diagnosed diseases like COPD, asthma and the other comorbid diseases that were measured could be over- or under-reported.
COPD Comorbidities
BRFSS data for the years of 2014 and 2015 included information about such health outcomes as asthma, coronary heart disease (CHD), depression, diabetes, kidney disease, myocardial infarction (MI), and stroke. Positive responses to “ever told you have” each of the aforementioned illnesses were used to calculate prevalence of each comorbidity in each state and the United States overall among 73,692 survey respondents with COPD.5 Individuals with pre-diabetes, borderline diabetes, and women with gestational diabetes were excluded. In addition, people with COPD who reported CHD, MI, and stroke were included into 1 group - those who had cardiovascular disease(s) (CVDs).
COPD Mortality
Crude and age-standardized mortality rates per 100,000 persons of all ages were obtained from the CDC’s National Center for Health Statistics, for the years of 2014-2015 on the CDC Wide-ranging ONline Data for Epidemiologic Research (CDC WONDER) released December 2016. The search included International Classification of Disease, 10th revision (ICD-10) codes J40 to J44.10
Other COPD-Related Statistics
The CDC chronic disease indicators (CDI) data provided information on various national and state-specific COPD-related metrics. These included age-adjusted prevalence of: (1) influenza and, (2) pneumococcal vaccination among noninstitutionalized adults aged 45 years or older with COPD for the year of 2016, and (3) the age-adjusted rates of hospitalization for COPD as first-listed diagnosis among Medicare-eligible persons aged 65 years and older in 2014.11
The data on age-adjusted 30-day COPD hospital readmission percentages for 2015 and the number of ED visits in 2015 for patients with COPD per 1000 all fee-for-service beneficiaries with COPD were available from the Centers for Medicare and Medicaid Services (CMS) Chronic Condition Data Warehouse.12
Data on adjusted per capita medical costs for COPD (in U.S. dollars) were obtained from the Medical Expenditures Panel Survey.4 Finally, the pulmonary rehabilitation directory from the American Association for Cardiovascular and Pulmonary Rehabilitation provided the information about the number of pulmonary rehabilitation (PR) programs in each state.13 We used these data, along with the COPD morbidity estimates calculated for 2014-2015, to derive the number of COPD patients per PR program in the states. This directory is the best-known source for PR programs in the United States, but there are likely a small number of programs not accounted for in these estimates.
MAPS-Key Metrics
The choropleth maps presented in Figures 1–4 show the United States using projection. Map preparation was carried out using SAS version 9.4 (SAS Institute Inc., Cary, North Carolina).
We grouped the states based upon their performance in the 10 key metrics. These key metrics included: the age-adjusted percentages of (1) adults with COPD in the state, (2) those who smoke, (3)(4) influenza and pneumococcal vaccination among noninstitutionalized adults aged 45 years and older with COPD; and (5) the crude percentage of 30-day COPD hospital readmission of all admissions of Medicare fee-for-service beneficiaries, (6) the crude number of ED visits for patients with COPD per 1,000 all Medicare fee-for-service beneficiaries with COPD, (7) the age-adjusted rate of hospitalization for COPD as first-listed diagnosis among Medicare-eligible persons aged 65 years and older, (8)per capita medical cost for COPD by state adjusted for demographics and such medical conditions as hypertension, dyslipidemia, diabetes, cancer, arthritis, back problems, injuries, renal failure, HIV/AIDS, skin disorders, and pregnancy, (9) the age-adjusted number of COPD patients per a pulmonary rehabilitation program in the state, and (10) the age-adjusted mortality rate from COPD per 100,000 adults of all ages in the state.
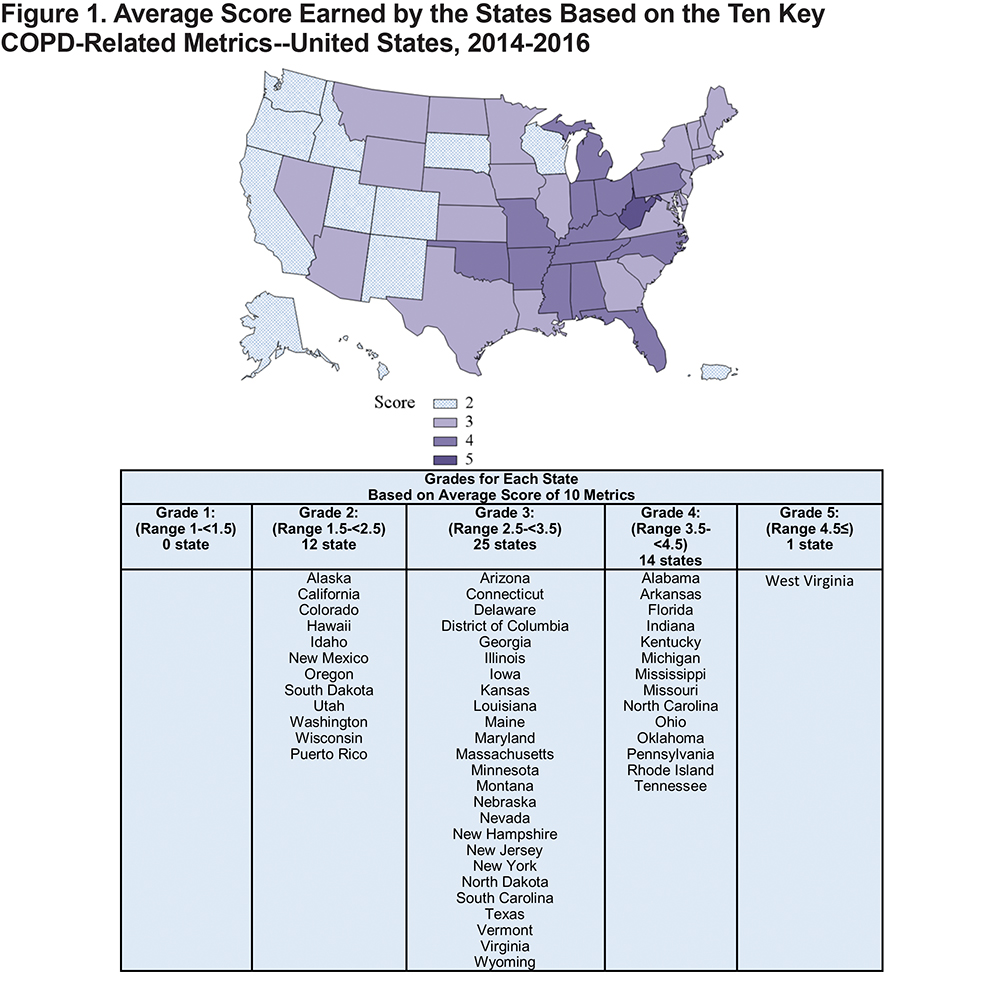
We ranked each state within these 10 areas using quintiles with 1 being best and 5 being worst (see Figures 2-4 and Figures 1-7 in the online supplement). Then, we calculated the average score earned by each state (see Figure 1). Finally, we derived 5 groups based on the overall scores for the states. The first group included states whose overall score ranged from 1 to<1.5. The scores for those in the second group ranged from 1.5 to <2.5. For the states in the third group, the overall scores ranged from 2.5 to<3.5. The range of the scores for those in the fourth group was from 3.5 to<4.5. Lastly, the fifth group included states that earned an overall score of 4.5 or above.
Results
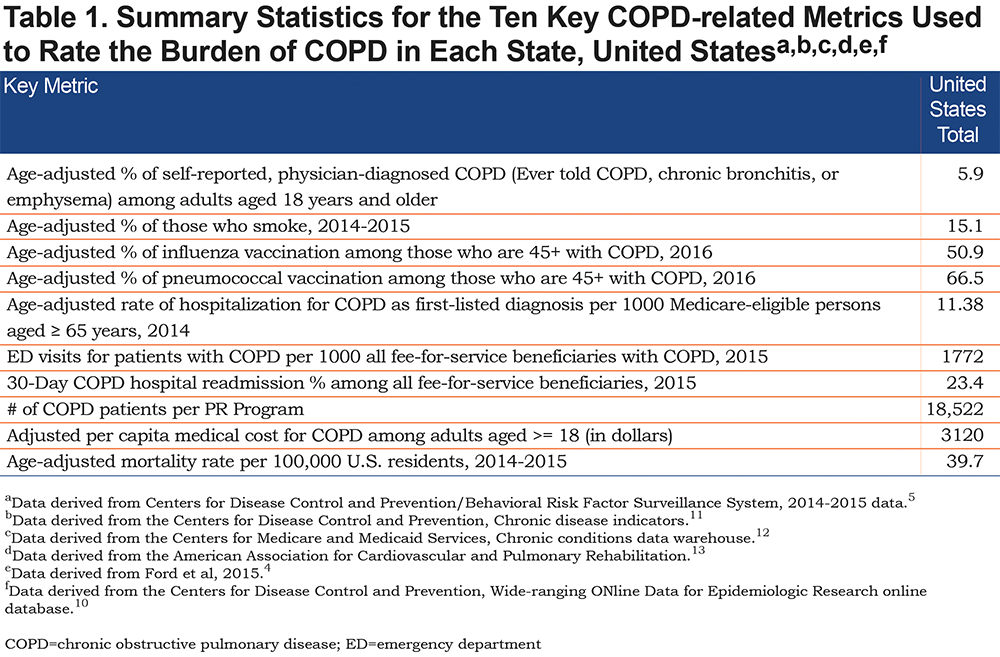
Table 1 shows summary statistics for the main COPD-related metrics, which were used to examine the burden of COPD in the states. The data are presented on a national level, for the United States. During 2014-2015, 5.9% of adults (more thank 15.9 million) reported having been diagnosed with COPD and approximately 15.1% of U.S. adults reported being smokers. The age-adjusted prevalence of influenza and pneumococcal vaccinations among adults with COPD, who were 45 years and older in 2016, was 50.9% and 66.5%, respectively. According to the CMS data, in 2015, the U.S. average number of ED visits for patients with COPD per 1000 all fee-for-service beneficiaries with COPD was 1772 and the 30-day COPD hospital readmission percentage of all fee-for-service beneficiaries with COPD was 23.4 %. Based on the CDI data, in 2014, the age-adjusted rate of hospitalization for COPD as first-listed diagnosis per 1000 Medicare-eligible persons aged 65 years and older was 11.38. According to the results, in the United States, on average, we observed 18,522 COPD patients per pulmonary rehabilitation program, and the average per capita medical cost of $3120 for COPD among adults aged 18 and older. Finally, based on the combined 2014-2015 data from the CDC WONDER website, the average age-adjusted mortality rate from COPD was 39.7 per 100,000 U.S. residents of all ages.
Online supplement Table 1 shows estimated number and prevalence of self-reported, physician-diagnosed COPD among U.S. adults aged 18 years or older, stratified by sex, race, age group, and income. According to these data, among adults 18 years and older, 5.3% of men and 6.4% of women have been told by their health care providers they have COPD. In addition, 6.4% of all non-Hispanic whites, 6.2% of all non-Hispanic blacks, and 3.7% of all adults of Hispanic ethnicity have been told they have COPD. Among individuals who are 18-24 years old, 2.1% have been told they have COPD. In addition, 2.5% of those aged 25-34, 3.4% of those 35-44 years old, 6.5% of those aged 45-55, 9.6% of adults aged 55-64, and 12.5% of adults aged 65 and older have been told they have COPD.
Among adults whose income is less than $15,000, 12.7% have COPD. In addition, 8.9% of adults whose income ranged from $15,000 to less than $25,000, 6.6% of those whose income ranged from $25,000 to less than $35,000, 5.4% of adults whose income ranged from $35,000 to less than $50,000, and finally, 3.2% of those whose income was equal to or greater than $50,000 have a COPD diagnosis.
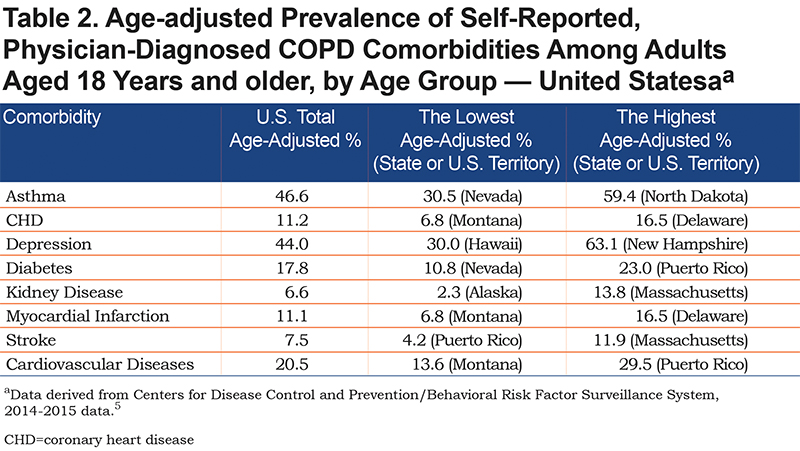
Table 2 shows age-adjusted prevalence of self-reported, physician-diagnosed comorbidities among adults with COPD in 2014-2015. The most prevalent self-reported comorbidity among COPD patients was asthma (46.6%), followed by depression (44%), diabetes (17.8%), CHD (11.2%), MI (11.1%), stroke (7.5%), and the least prevalent, kidney disease (6.6%). Overall, 20.5% of COPD patients reported CVDs (i.e., CHD/MI/stroke).
Online supplement Table 2 presents estimated number, crude and age-adjusted prevalence of self-reported, physician-diagnosed COPD among U.S. adults aged 18 years and older by state and U.S. territories. State level estimates stratified by sex, race, and income are presented in online supplement Table 2a. The age-adjusted percentage of self-reported, physician-diagnosed COPD ranged from 3.7% for Puerto Rico to 12% for West Virginia. The crude weighted percentage of self-reported, physician-diagnosed COPD was also the highest for the state of West Virginia (13.4%), but the lowest for Utah (3.6%). Online supplement Table 2b shows estimated number as well as unadjusted prevalence of self-reported, physician-diagnosed COPD among U.S. adults aged 18 years and older, by state and age group. Based on these results, the unadjusted prevalence of self-reported, physician-diagnosed COPD increases with age.
The age-adjusted prevalence was slightly higher for women in all of the states except for Hawaii, Wyoming, and also Puerto Rico where prevalence was higher, although insignificantly, for men. For most of the states, increase in income was associated with decrease in the age-adjusted percentage of self-reported physician-diagnosed COPD.
Online supplement Tables 3-4 present estimated number, crude and age-adjusted prevalence of self-reported, physician-diagnosed COPD comorbidities among U.S. adults aged 18 years and older for the United States and stratified by state, respectively.
Online supplement Table 5 shows average number and unadjusted and age-adjusted mortality rates per 100,000 persons of self-reported, physician-diagnosed COPD among adults of all ages in the United States overall and stratified by state for the years of 2014-2015. The total average number of deaths from COPD in the United States for the years of 2014-2015 was 146,412. The average crude and age-adjusted mortality rates per 100,000 persons were, 45.7 and 39.7, respectively. The age-adjusted mortality rate ranged from 15.6 per 100,000 persons for Hawaii to 63.1 per 100,000 persons for Oklahoma.
Ratings of the States Based on the Key Metrics
Figure 1 shows the distribution of the overall score earned by the states and the U.S. territories. Based on the mean of the individual component scores in each of the 10 key metrics used to rate the states, the majority (n=25) of the states were in the middle, falling within the third group, which included states with an overall score of 2.5 to <3.5. Specifically, these were Arizona, Connecticut, Delaware, District of Columbia, Georgia, Illinois, Iowa, Kansas, Louisiana, Maine, Maryland, Massachusetts, Minnesota, Montana, Nebraska, Nevada, New Hampshire, New Jersey, New York, North Dakota, South Carolina, Texas, Vermont, Virginia, and Wyoming.
According to our rankings, none of the states demonstrated a low burden of COPD, and only 11 states and 1 U.S. territory obtained the next highest rating (i.e., the state’s average score ranged from 1.5 to <2.5). Those states included Alaska, California, Colorado, Hawaii, Idaho, New Mexico, Oregon, South Dakota, Utah, Washington, Wisconsin, and Puerto Rico. On the other hand, almost one third of the states received an average score of 3.5 and higher, demonstrating generally severe burden within the 10 examined COPD-related areas, with the lowest score being 4.6 for West Virginia.
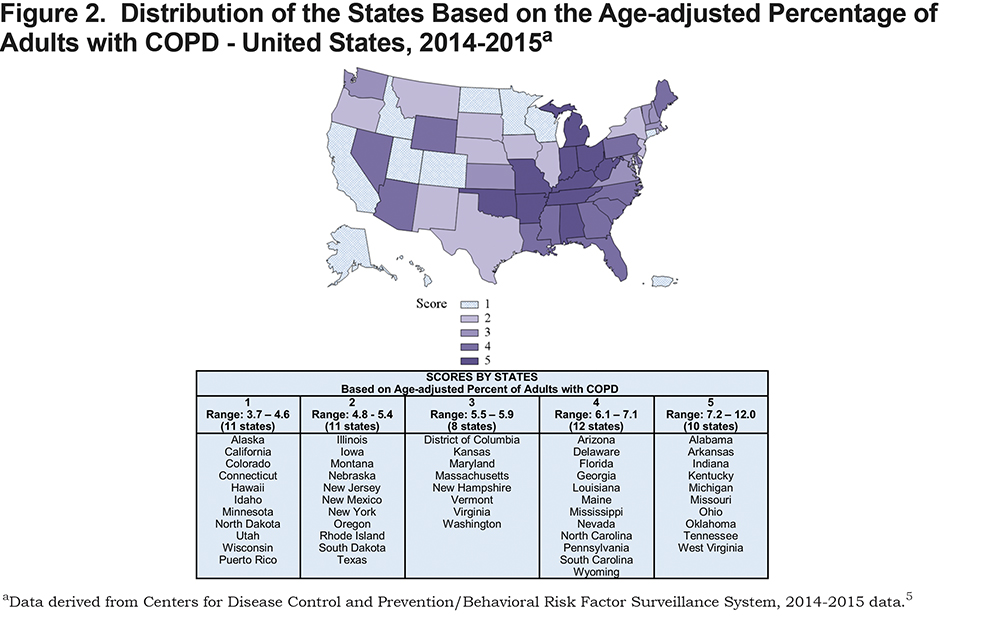
Figures 2-4 show the distribution of the states’ scores within 4 selected key areas. Figure 2 shows a relatively equal distribution of scores earned by states based on the age-adjusted prevalence (AAP) of adults with COPD. Specifically, there were 11 states in the first group whose prevalence percentage ranged from 3.7% to 4.6%, 11 states in the second group (with AAP ranging from 4.8% to 5.4%), 8 states in the third group (AAP of 5.5% to 5.9%), 12 states in the fourth group (AAP of 6.1% to 7.1%), and 10 states in the fifth group that had the highest age-adjusted prevalence ranging from 7.2% to 12.0%.
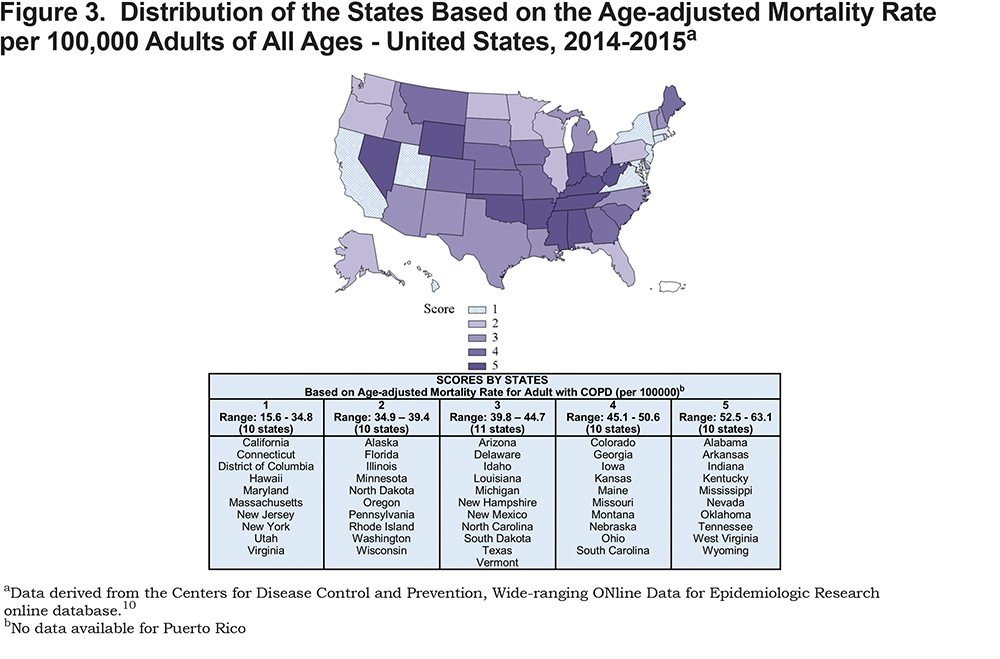
According to Figure 3, we can also observe a uniform distribution of scores earned by states based on the age-adjusted mortality rate from COPD per 100,000 adults of all ages in 2014-2015. Specifically, there were 10 states in the first group whose mortality rates ranged from 15.6 to 34.8, 10 states in the second group (with the rate ranging from 34.9 to 39.4), 11 states in the third group (with the rates of 39.8 to 44.7), 10 states in the fourth group (with the rates of 45.1 to 50.6), and 10 states in the fifth group with the highest age-adjusted mortality rates of 52.5 to 63.1.
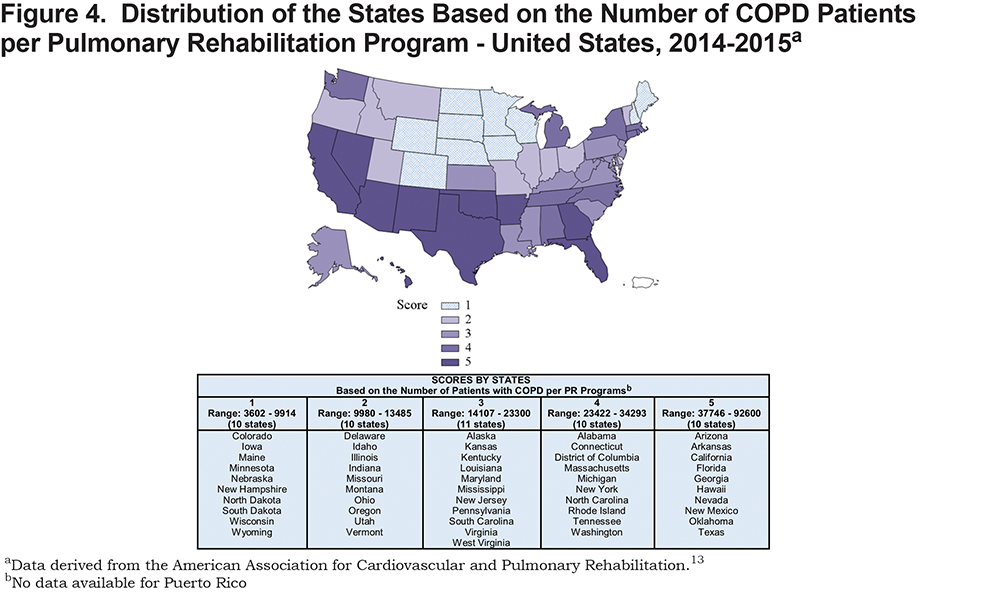
Finally, Figure 4 shows the distribution of states based on the number of patients with COPD per a pulmonary rehabilitation program in each state. Similar to previous results, we observe an equal distribution of scores earned by states with 10 states in each of the 4 groups (groups 1, 2, 4 and 5), and 11 states in the third group. The number of patients with COPD per PR program ranged from 3602 to 9914 in the first group, 9980 to 13,485 in the second group, 14,107 to 23,300 in the third group, 23,422 to 34,293 in the fourth group, and 37,746 to 92,600 in the fifth group.
Discussion
This document presents an updated surveillance for each state and the United States overall, including choropleth maps to visualize the current situation with COPD morbidity and mortality in the country. This document also provides new information about the relationship between COPD and several other serious comorbid diseases at the national and state levels. Publicly available data from multiple sources were used to generate this summary.
The data presented in the “COPD in the States Project” highlights the serious burden that COPD places on individuals, the health care system and the economy, and it reinforces the need for increased focus on COPD at all levels. The COPD National Action Plan, released in May 2017, provides a blueprint for public and private action across 5 broad goals related to COPD awareness, diagnosis, treatment, surveillance, research and policy. In the aftermath of the National Action Plan’s release, the “COPD in the States Project” was initiated by the COPD Foundation to identify how impacts vary by state and region and to provide information to guide decision making and resource prioritization.
The results showcase variability across states overall and within key metrics. Even in states that were at the top of the rankings, the burden of COPD is severe and deserving of further investigation. Overall, the average scores across 10 key metrics are consistent with previously published data suggesting the states in Appalachia, the Mississippi delta, and parts of the South, largely rural areas, have worse COPD outcomes. The results also mirror past research that suggests socio-economic factors, like poverty levels, play a role in the burden of COPD, in addition to smoking prevalence in the state. There are examples of a state’s scores across metrics that require additional investigation, and metrics with public health and payment implications, such as vaccinations and hospital readmissions, can be examined further to identify factors associated with better performing states.
Colorado is in the first quintile for overall prevalence of COPD, but in the fourth for mortality rate and fifth for both influenza and pneumococcal vaccine. States such as Maryland and Massachusetts rank in the first quintile for mortality rate, yet land in the fourth and fifth quintile for ED visits and 30-day hospital readmissions. In most cases, scores in percentage of smokers are aligned with COPD prevalence, however, there are several examples of states ranked in the fourth or fifth quintile in smoking prevalence and in the second quintile for COPD prevalence indicating the potential for undiagnosed COPD, non-smoking related COPD or potentially greater success in achieving smoking cessation in those diagnosed with COPD. Results from the number of COPD patients per available pulmonary rehabilitation program reinforce the significant deficit in access to this evidence-based therapy. Further study to better quantify the capacity of known programs and identify those missing from the American Association of Cardiovascular and Pulmonary Rehabilitation directory13 is necessary to prioritize areas of focus for new program start up and innovative model testing.
The comorbidity analysis provides valuable new information about the serious diseases that are experienced by COPD patients. Notably, the connection to depression, which occurs in nearly 50% of COPD patients, suggests the need to reinforce the importance of mental health screening and referrals in this population and could guide future disease management and peer support programming. The data also showed that a significant number of COPD patients face common chronic conditions like diabetes and heart disease, raising the potential for adapting existing public health interventions that are widely implemented in these conditions to include a COPD component and also suggesting the need for an increased focus on team-based, coordinated care for these patients.
The “COPD in the United States” project included additional data and assessment of a state’s current response to COPD. This report and the accompanying public documents on the COPD Foundation’s website14 are intended to spur additional conversation about how stakeholders and institutions can prioritize and implement strategies in the COPD National Action Plan and begin to address the growing burden COPD is placing on individuals, families and institutions in the United States.
Declaration of Interest
Jamie Sullivan and Tracie Sullivan are staff members of the COPD Foundation. Keith Siegel is a paid consultant for the COPD Foundation. The other authors have no relevant interests to disclose.