Article Text

Abstract
Objective: To appraise the evidence on the diagnostic accuracy of CT pulmonary angiography and the prognostic value of a negative CT pulmonary angiogram in the diagnosis of pulmonary embolism.
Methods: Medline, EMBASE, and grey literature were systematically searched by two researchers. Any study which compared CT pulmonary angiography to an acceptable reference standard or prospectively followed up a cohort of patients with a normal CT pulmonary angiogram was included. Study methods were appraised independently by two researchers, and data were extracted independently by three researchers.
Results: Thirteen diagnostic and 11 follow up studies were identified. Studies varied in prevalence of pulmonary embolism (19–79%), patient groups, and method quality. Few studies recruited unselected emergency department patients. There was heterogeneity in the analysis of sensitivity (53 to 100%), specificity (79 to 100%), and false negative rate (1.0 to 10.7%). The pooled false negative rate of combined negative CT pulmonary angiography and negative deep vein thrombosis testing was 1.5% (95% CI 1.0 to 1.9%).
Conclusion: Diagnostic studies give conflicting results for the diagnostic accuracy of CT pulmonary angiography. Follow up studies show that CT pulmonary angiography can be used in combination with investigation for deep vein thrombosis to exclude pulmonary embolism.
- pulmonary embolism
- CT scan
- diagnosis
Statistics from Altmetric.com
The diagnosis of pulmonary embolism is challenging as symptoms of pulmonary embolism are varied and range from mild, non-specific lethargy or breathlessness, to collapse and cardiac arrest.1–3 Recurrent pulmonary embolism is associated with a case mortality of 26%.4 Early diagnosis is essential as even patients with minor symptoms are at risk of recurrent pulmonary emboli.
The combination of a normal D-dimer concentration and low clinical probability score5–7 provides a robust screening method, facilitating exclusion of pulmonary embolism without diagnostic imaging. The PIOPED study8 proposed combining ventilation-perfusion scanning with clinical probability for the safe exclusion and diagnosis in a subset of patients. This strategy does not exclude or diagnose pulmonary embolism in all suspected cases. The gold standard investigation—pulmonary angiography—is invasive and carries a recognised morbidity and mortality.9 Furthermore, a normal angiogram is associated with a 1.6% incidence of venous thromboembolism in the following year.10
Computed tomographic pulmonary angiography (CT pulmonary angiography) is increasingly used in the diagnosis of pulmonary embolism. CT has the advantage of imaging the entire thorax, facilitating the diagnosis of conditions mistaken for pulmonary embolism, such as pneumonia, aortic dissection, and malignancy.11 UK and US guidelines have planted CT among the basic investigations for pulmonary embolism.12,13 Attempts to evaluate the clinical utility of CT pulmonary angiography have been complicated by rapid advances in CT scanning technology, acceptance that angiography may not be the most appropriate reference standard, and heterogeneous study populations.
The aim of this study was to appraise the diagnostic accuracy of CT pulmonary angiography in the emergency department diagnosis of pulmonary embolism and the prognostic value of a negative CT pulmonary angiogram.
METHOD
Search strategy
Searches were conducted on Medline (Ovid interface 1966–July week 2, 2005) and EMBASE (1980–week 29, 2005) using the following search strategy: [Exp Tomography, X-ray Computed, OR CT.mp OR Computed tomograph$.mp] AND [exp pulmonary embolism OR pulmonary embol$.mp. OR PE.mp. OR exp thromboembolism OR pulmonary infarct$.mp] LIMIT to human. The ACP Journal Club, Cochrane Database of Systematic Reviews, Database of Abstracts of Reviews of Effects, MEDION-database, SIGLE database of grey literature, and the international published guidelines for diagnosis of pulmonary embolism were searched for any further references. All database searches were conducted independently by two researchers who reviewed the titles and abstracts of database search results. All potentially relevant papers were sourced in full. Studies published in languages other than English were translated. The reference sections of all publications were cross referenced. Lastly, experts in the field from the UK, USA, France, and Switzerland were contacted to identify further unpublished data.
Inclusion criteria
Studies were analysed if they were either a diagnostic study assessing the accuracy of CT pulmonary angiography in diagnosing pulmonary embolism or a follow up study that recruited a cohort of patients with negative CT pulmonary angiograms and followed them clinically. Studies of chronic pulmonary emboli and those using electron beam CT scanners were excluded.
To be included, diagnostic studies had to apply an adequate reference standard to all patients or a subgroup of patients. A high probability ventilation-perfusion scan in a patient with high clinical probability of pulmonary embolism, a positive investigation for deep vein thrombosis, or positive pulmonary angiography were considered adequate to confirm pulmonary embolism. A normal or near normal ventilation-perfusion scan was adequate to exclude pulmonary embolism as was a low probability ventilation-perfusion scan combined with either low clinical probability or an uneventful three month follow up. The CT scan result had to form no part of the reference standard diagnosis of pulmonary embolism. Data had to be presented as true positive, false positive, true negative, and false negatives.
Only prospective follow up studies with a greater than 85% follow up rate involving patient contact were included. In addition it had to be possible to calculate the number of patients who developed deep vein thrombosis or pulmonary embolism during the follow up period.
Two clinical researchers examined all potential papers. In the event of a discrepancy, a third was asked to review the study.
Quality appraisal
Each included study was appraised for quality using predetermined guidelines (appendices 1 and 2). In particular, diagnostic papers were appraised to establish whether the reference standard investigation was blinded to the CT pulmonary angiogram result and vice versa. Follow up studies were appraised to establish whether the outcomes included both pulmonary embolism and deep vein thrombosis, that a uniform assessment was applied to all patients following the negative CT, and details of further diagnostic tests were given. The length of follow up, whether personal contact had been employed in all cases and whether all deaths were examined by postmortem or an adjudication panel, was also assessed.
All studies were evaluated for evidence of a consecutive cohort, details of the recruitment process, number of centres involved, and prevalence of pulmonary embolism among the study population. Details of inclusion criteria, inpatient/outpatient mix, comorbidity, and a record of all previous diagnostic tests were sought as were exclusion criteria and the demographics of those excluded.
Details of the process of CT pulmonary angiography were appraised checking whether the scans were interpreted blinded to the reference standard investigation, the CT scanner type, technique, and diagnostic criteria, and the number of radiologists interpreting each CT scan.
This appraisal was performed independently by two researchers. In the case of a discrepancy, a third was asked to appraise the study.
Data extraction
For each diagnostic study the numbers of true positive, false positive, true negative, and false negative patients were extracted independently by three researchers. Two studies compared the results from experienced and junior radiologists interpreting CT scans. In this case only the results for the experienced radiologists were used.
For each follow up study the number of false negative CT scans was calculated independently by three researchers. Any positive venous ultrasounds, high probability ventilation-perfusion scans, positive pulmonary angiograms, or deaths caused by pulmonary embolism were considered to represent false negative CT scans.
Statistical methods
Sensitivity and specificity were calculated for CT pulmonary angiography. The false negative rates were calculated for CT pulmonary angiography alone and CT pulmonary angiography combined with a deep vein thrombosis investigation. These results were recorded in Excel (Microsoft Excel, USA) and Forest plots with Mantel-Haenszel weighting were constructed using StatsDirect (StatsDirect Ltd, Cheshire, UK). The presence of a cut off point effect was assessed by calculating the Spearman correlation coefficient between sensitivity and specificity.14 The random effects model was employed to pool data using Stata version 7.0 (Stata Corp LP, Texas, USA).
RESULTS
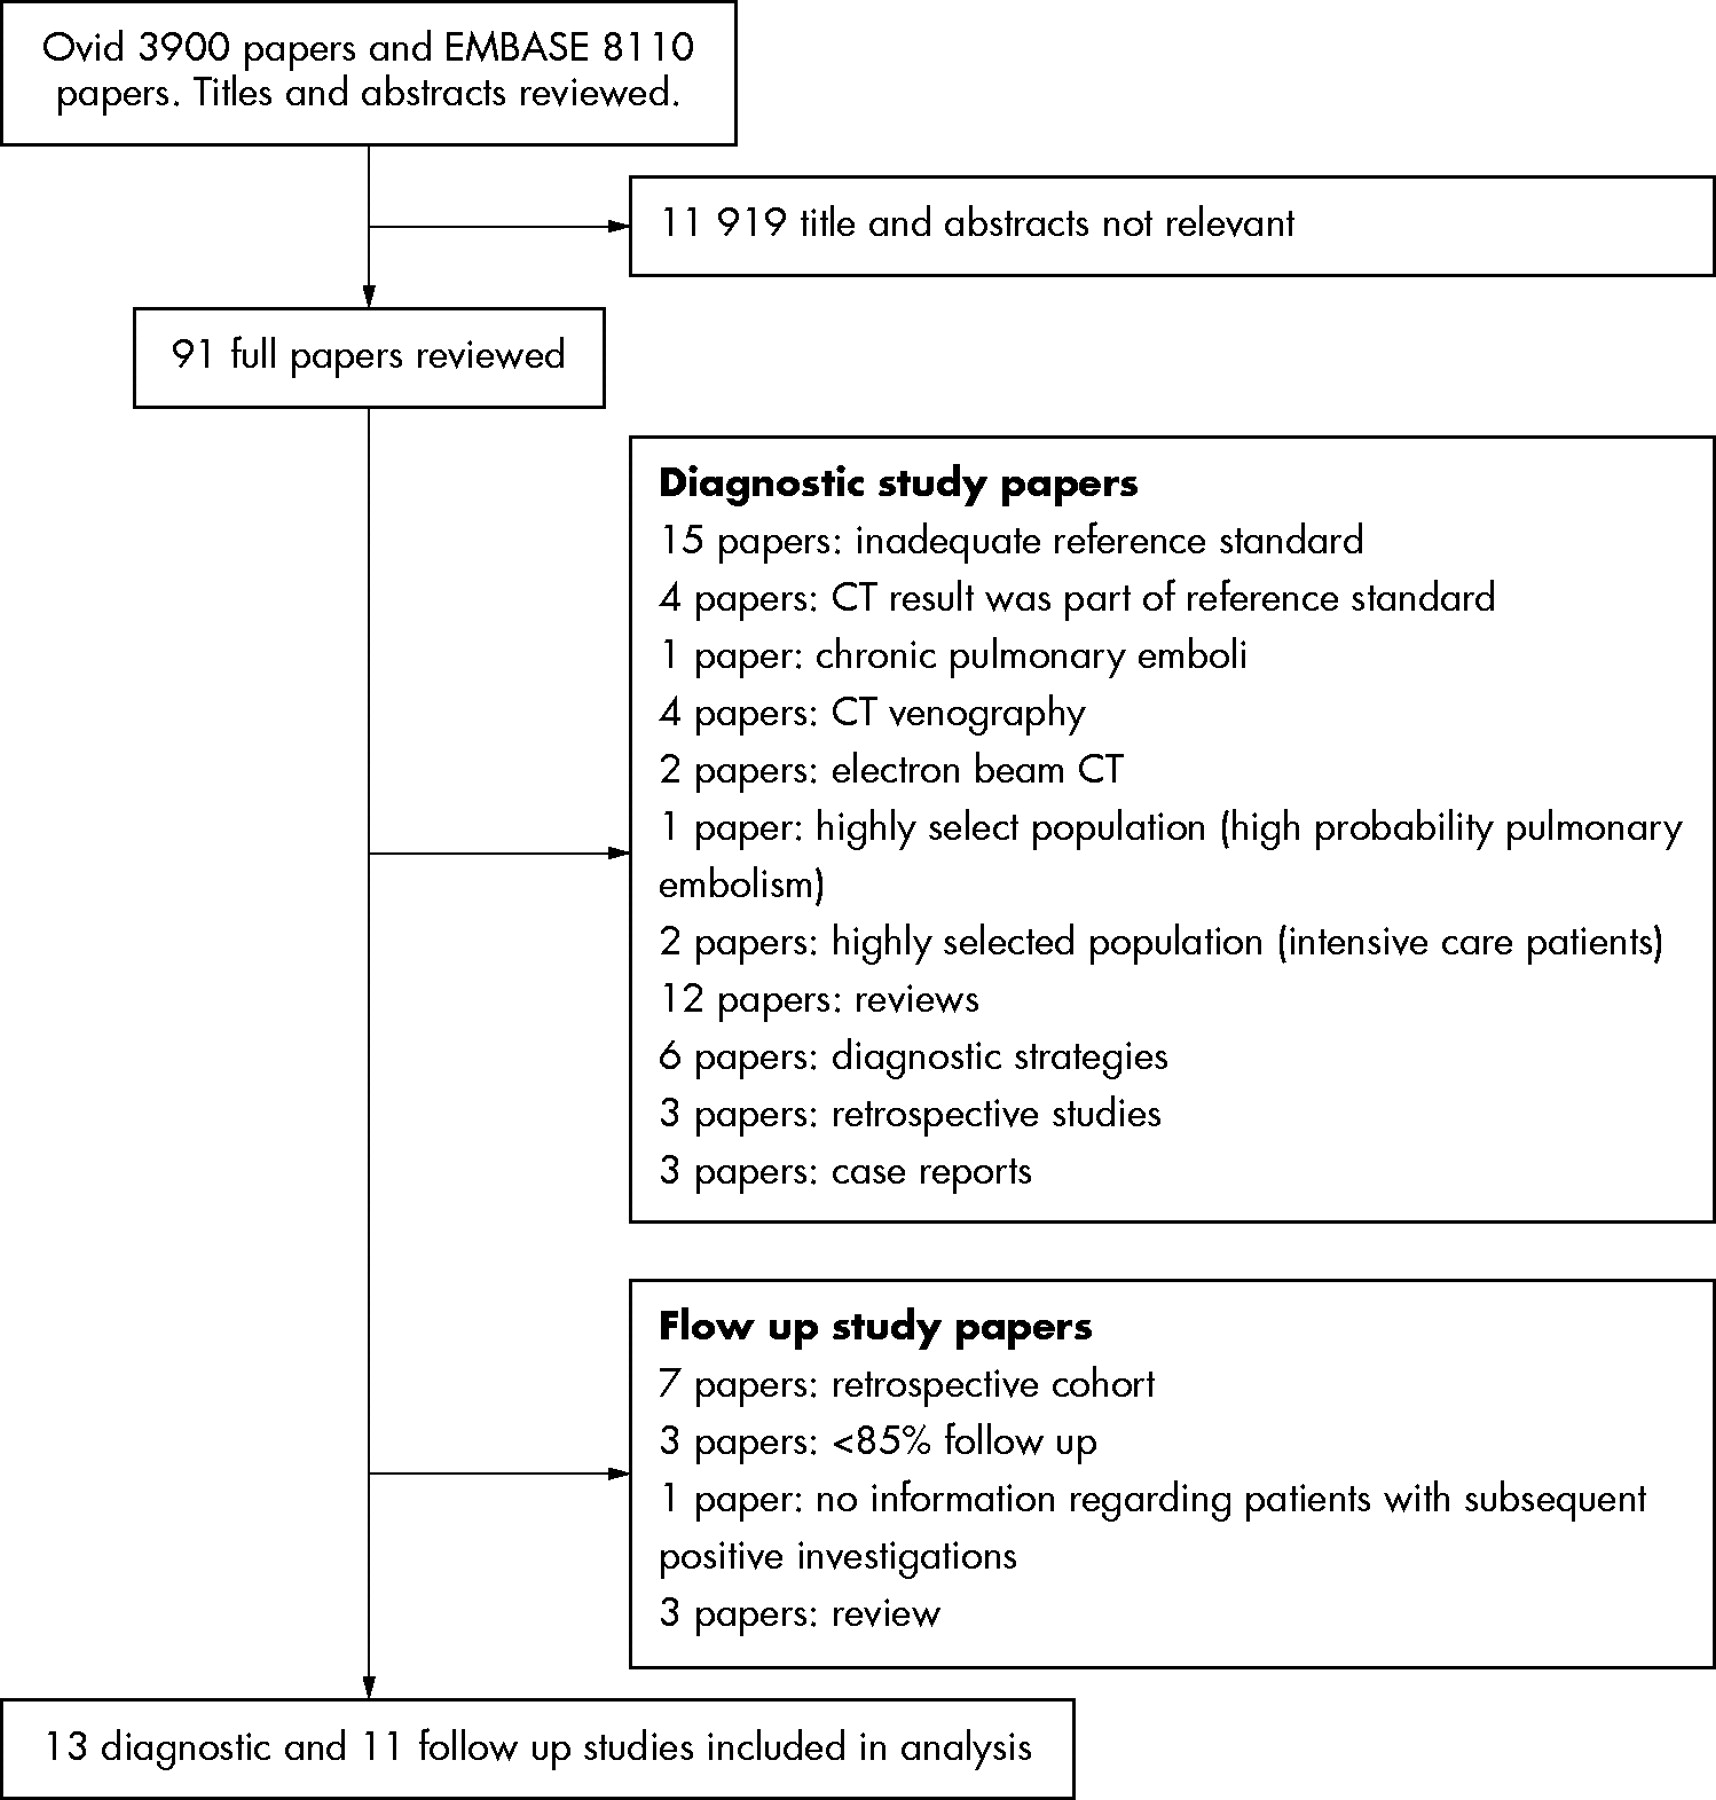
The OVID search found 3900 papers and EMBASE 8110 papers. The results of the systematic search are shown in figure 1. Twenty four studies meeting the inclusion criteria were included. One study recruiting patients suspected of massive pulmonary embolism (n = 10) and two studies recruiting intensive care patients (a different population to the emergency department, n = 59) were excluded.

Systematic review results.
Diagnostic studies
Thirteen were diagnostic studies (summarised in table 1).15–27 Twelve used pulmonary angiography alone as a gold standard, with one19 using a diagnostic algorithm. The patient groups ranged from emergency department patients suspected of pulmonary embolic disease15 to highly selected groups.22,27 The prevalence of pulmonary embolism ranged from 19% to 79%. Only one was a multicentre study.15 All but three studies used a single detector CT scanner and 12 studies employed two or more radiologists to interpret the CT scan. One study did not stipulate the number of radiologists.27 Appraisal scores varied widely.
Diagnostic studies for analysis
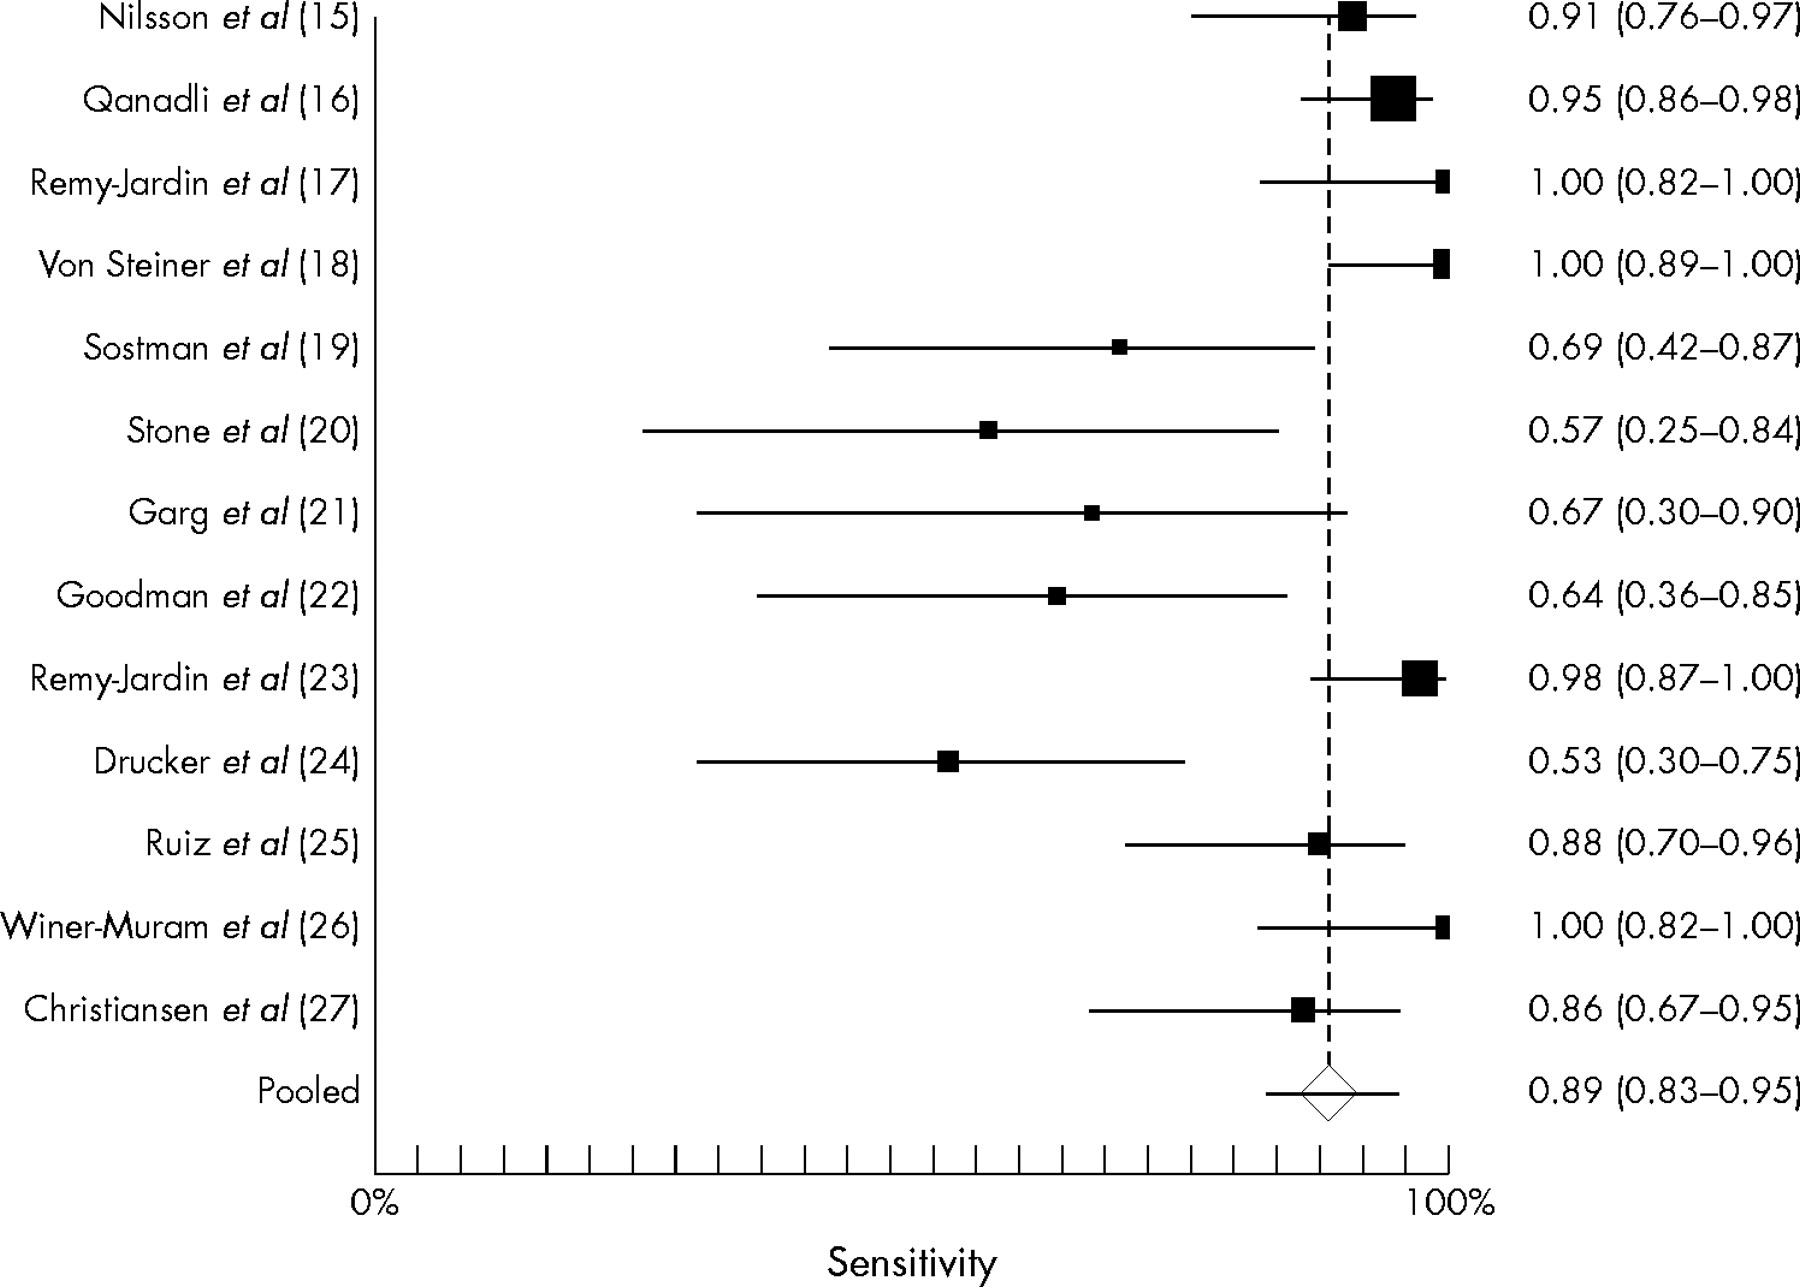
Figure 2 shows the weighted sensitivities for the diagnostic studies. Figure 3 shows the weighted specificities for the diagnostic studies. Sensitivity varied markedly between studies (Breslow-Day test for heterogeneity p = 0.001). Although there was less variation in specificity, the studies were heterogeneous (Breslow-Day test p = 0.004). The random effects pooled result for sensitivity was 88.9% (95% CI 82.0 to 95.0%) and specificity 94.6% (95% CI 91.3 to 98.0%). Subgroups were analysed (emergency department patients, patients with ventilation-perfusion scans, patients with ultrasound scans, patients referred for pulmonary angiography, or studies with high appraisal scores). Two studies recruited mainly outpatients,15,16 both giving high sensitivity and specificity. No other subgroup analysis improved heterogeneity. Sensitivity and specificity were poorly correlated (Spearman p = 0.017).

Forest plot for sensitivity.
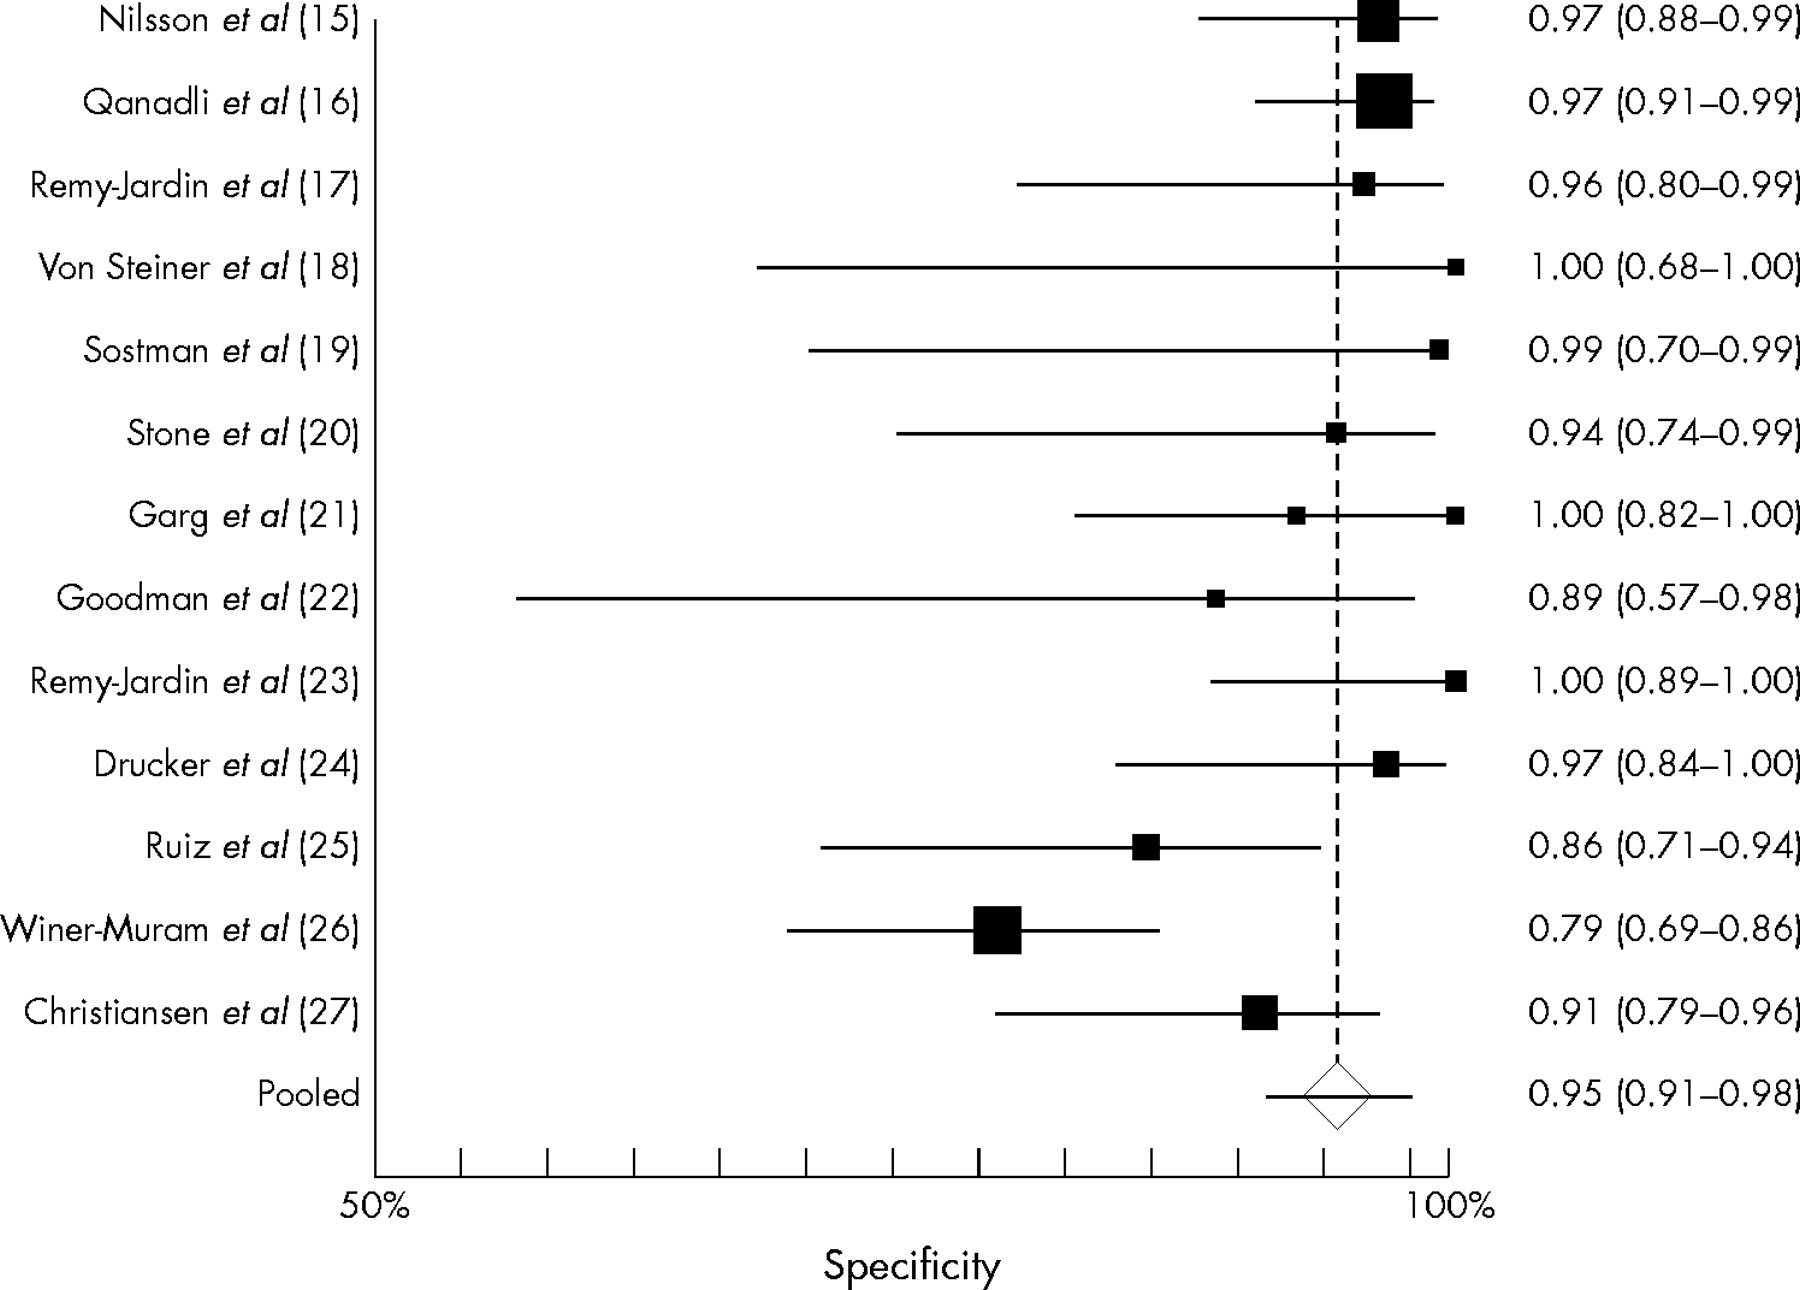
Forest plot for specificity.
Follow up studies
Eleven prospective follow up studies were identified (table 2).28–38 These ranged from unselected patients suspected of pulmonary embolic disease28–30 to patients with high clinical probability of pulmonary embolic disease and a non-diagnostic ventilation-perfusion scan.34 Four were multicentre studies.28,30–32 Only four studies28,30–32 insured that all patients underwent a uniform investigative process after the negative CT pulmonary angiogram. One study37 followed up patients for pulmonary embolism only, excluding data on deep venous thrombosis. Follow up ranged from examinations at six weeks and three months30 to one telephone call at six months.34 Seven studies achieved follow up rates of 95% or above. Two studies followed up 93% of patients29,37 and one study followed only 87%.36 Mortality during follow up was as high as 32%34 and 14%.29 Neither of these studies employed postmortem examination or an independent adjudication committee to ascertain cause of death. Four studies used an adjudication committee to review study deaths.28,30–32
Follow up studies for analysis
Figure 4 shows the weighted false negative rates for the follow up studies. The results are heterogeneous (Breslow-Day test p = 0.000). A sensitivity analysis removing studies with poor appraisal scores did not reduce the heterogeneity, nor did patient subgroup analysis (emergency department patients, patients with ventilation-perfusion scans, patients with ultrasound scans, or patients referred for pulmonary angiography).
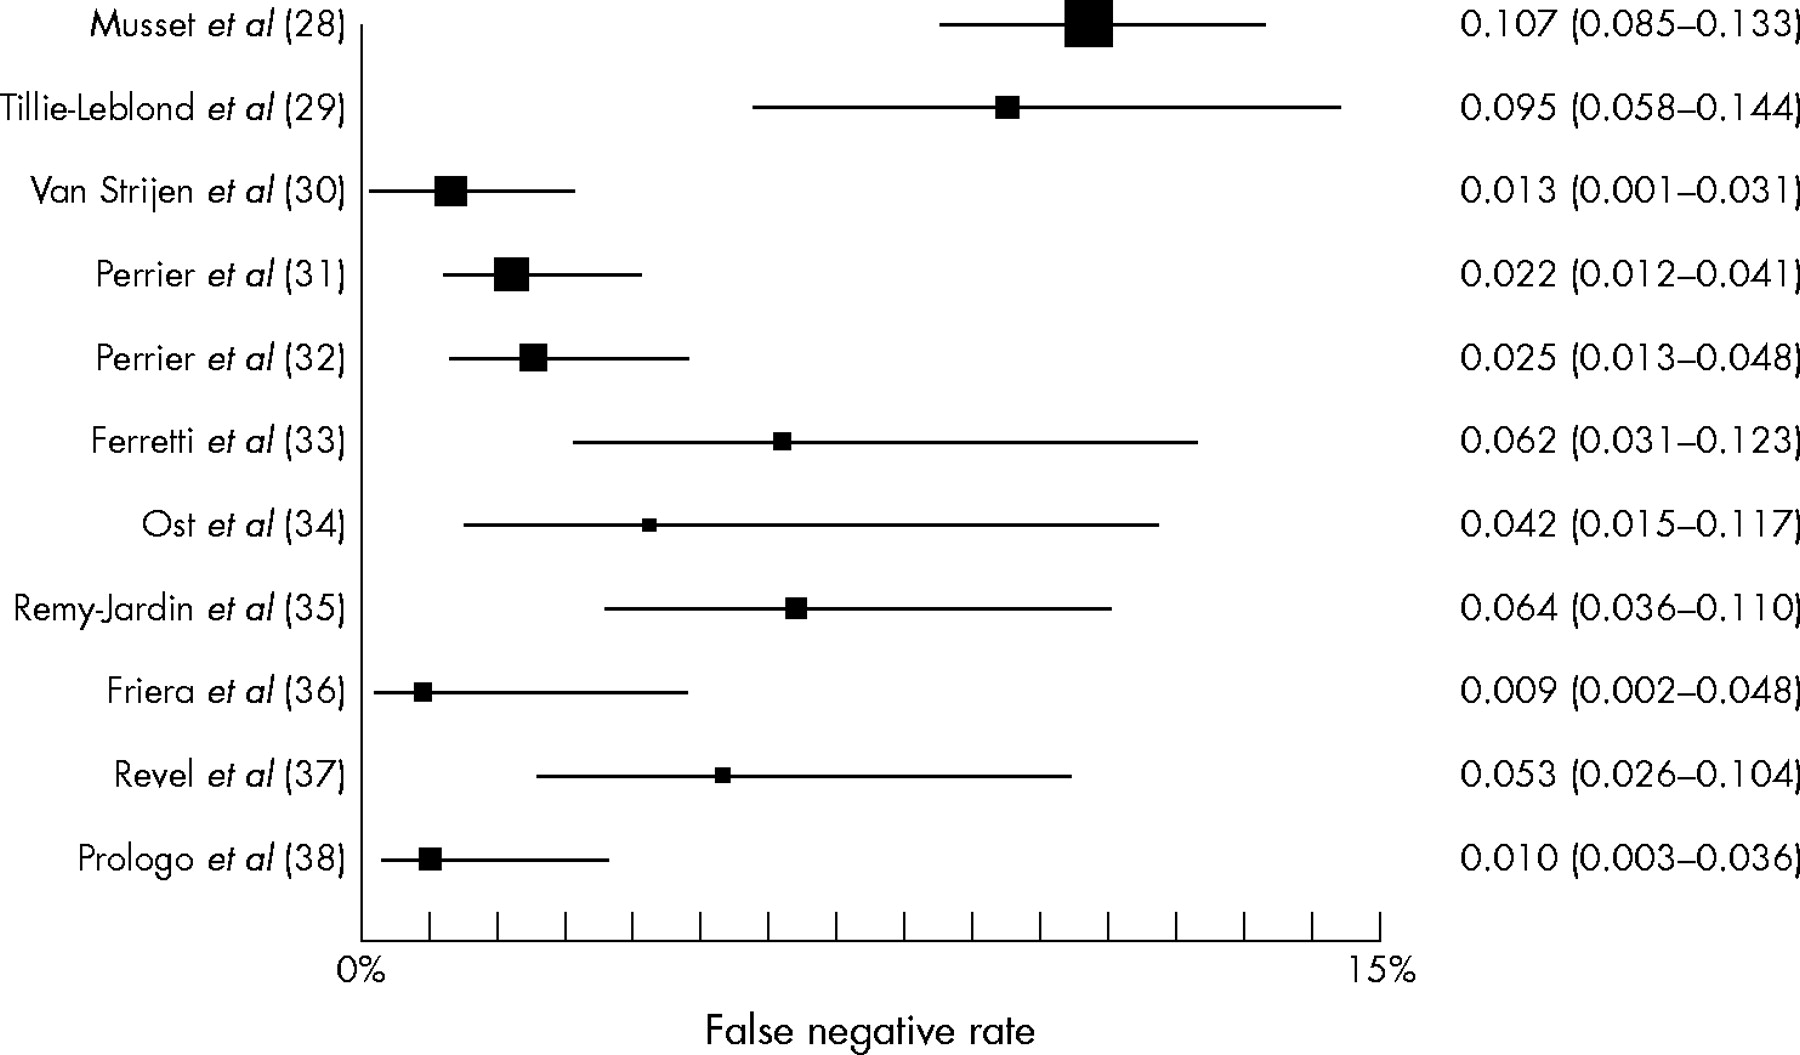
Forest plot for false negative rate of CT pulmonary angiography.
The false negative rates were calculated for patients with both a negative investigation for deep vein thrombosis and negative CT angiography on presentation. The results are displayed in figure 5. The data are homogeneous (Breslow-Day test p = 0.382). The random effects pooled false negative rate was 1.5% (95% CI 1.0 to 1.9%).

Forest plot for false negative rate of combined CT pulmonary angiography and DVT investigation. (Study 29 all had CT but only 84% cohort had an ultrasound scan. Study 37 all had CT but only 90% cohort had CT venography.)
DISCUSSION
There are very few high quality studies assessing the diagnostic utility of CT pulmonary angiography in pulmonary embolism. Few study cohorts represent the emergency department population. There are conflicting results for the sensitivity and specificity of CT pulmonary angiography. The false negative rate for CT pulmonary angiography varies between studies. The pooled false negative rate for combining negative CT pulmonary angiography with a negative investigation for deep vein thrombosis was 1.5% (95% CI 1.0 to 1.9%).
Sensitivity of CT pulmonary angiography is heterogeneous ranging from 53% to 100%. The pooled result for sensitivity was 88.9% (95% CI 82.0 to 95.0%), however given the heterogeneous study methods and populations (as noted by Eng et al39) this figure may not accurately represent the true value for sensitivity. It is possible that radiologists in different studies interpret CT pulmonary angiograms using different thresholds for the cut off point between a positive and negative scan. However variation cannot be explained by a cut off point effect since sensitivity and specificity are poorly correlated. Most studies calculated sensitivity with very small cohorts and large confidence intervals. Two of the largest studies15,16 recruited outpatients (emergency department patients) finding sensitivities of 91% (95% CI 76 to 97%) and 95% (95% CI 86 to 98%). They had a similar prevalence of disease (37% and 39% respectively) and may be most representative of the emergency department population. Both studies used single slice scanners and scored reasonable appraisal scores.
Specificity varied less. The pooled specificity result was 94.6% (95% CI 91.3 to 98.0%). All results were over 90% with the notable exception of two studies.25,26 The study by Ruiz et al used a single slice scanner and recruited patients referred for pulmonary angiography. No demographics were provided about the patient cohort, and it is hard to establish why this study differed from the others. Winer-Muram et al were the only diagnostic study researchers to use a four channel multidetector row CT scanner. Notably, this did not appear to improve the ability to correctly exclude smaller peripheral emboli and gave the poorest specificity result of 79% (95% CI 69 to 86%).
Almost all diagnostic studies used pulmonary angiography as the reference standard investigation. Pulmonary angiography can diagnose pulmonary emboli in the small, peripheral pulmonary vasculature. Single slice CT scanning may be less accurate in identifying these emboli. However clinicians are uncertain of the clinical significance of such small emboli which may not require anticoagulant therapy. Follow up studies provide practical evidence on the clinical safety of withholding anticoagulant therapy from patients who have thromboembolism excluded on CT scan. This is a more relevant question for the emergency physician.
The reported false negative rates varied between studies from 0.9% to 10.7%. In this analysis we considered deep vein thrombosis to be a marker for pulmonary embolism as deep vein thrombosis is a manifestation of the same disease. Our false negative results may be an overestimation as not every patient with a deep vein thrombosis will have a pulmonary embolism. In fact patients with a recent diagnosis of venous thrombosis may become concerned about relatively benign chest symptoms and be recruited onto a study.
The pooled false negative rate for combined negative CT angiography and negative deep vein thrombosis testing was 1.5% (95% CI 1.0 to 1.9%). Despite the varied results on sensitivity and specificity, CT pulmonary angiography in combination with ultrasonography or CT venography appears to be a safe approach to the exclusion of pulmonary embolism. Our results concord with an older review40 which showed that studies combining a negative CT pulmonary angiogram with a negative ultrasound gave a smaller estimated negative likelihood ratio for pulmonary embolism than other conventional diagnostic tests. The PIOPED study10 demonstrated that a normal pulmonary angiogram has a false negative rate of 1.6%. This is similar to CT combined with deep vein thrombosis testing. CT avoids cardiac catheterisation, can be performed more readily in more hospitals and facilitates the diagnosis of other emergency conditions commonly mistaken for pulmonary embolism.
Most studies in this review used a single slice CT scanner. Today, many hospitals have multislice CT scanners which produce images with less movement artefact, better arterial contrast filling, and more detail. Although our results may not be applicable to multislice CT scanners we might see an increase in CT accuracy with the new technology, rather than a reduction.
We chose not to categorise results by the site of the pulmonary embolism. Although this may be seen as a criticism of the review, in the practicing world physicians request a CT pulmonary angiogram without specifying the levels to which images should be analysed. Likewise we chose not to look at interobserver variation in CT reporting. A meta-analysis will not establish accuracy of reporting in a given institution. Instead we focussed on three simple outcomes: sensitivity, specificity, and false negative rate.
Follow up studies give vital evidence on the safety of withholding treatment after a normal CT pulmonary angiogram and for that reason were included. Two other reviews41,42 have pooled information from follow up studies. However the authors included retrospective studies and quoted the authors’ non-standardised false negative rates. We chose to exclude retrospective studies to ensure a higher standard of follow up data and independently recalculated the sensitivity, specificity, and false negative rates.
Before the true sensitivity and specificity of CT pulmonary angiography can be estimated, more multicentre studies of high quality are required. Most UK hospitals use multislice scanners (with up to 64 channels). As yet, there is little evidence on the diagnostic utility of multislice CT pulmonary angiograms. With rapidly progressing technology and accumulative CT interpretation experience, we may find results with compatible accuracy to pulmonary angiography.
Acknowledgments
The authors would like to acknowledge the help provided by Michelle Jenkins and Katherine Wylie in sourcing the journal papers.
CONTRIBUTORS‘ STATEMENT KH designed the study. KH, GB, JW, BF, and KMJ participated in the systematic review, data extraction and study appraisal. JD provided statistical expertise. KH, BF, SC, and KMJ drafted the paper.
REFERENCES
Supplementary materials
Files in this Data Supplement:
- view PDF -
Appendix 1. Appraisal table for diagnostic studies.
Appendix 2. Appraisal table for follow-up studies.
- view PDF -
Footnotes
-
Financial support: none.
-
Competing interests: none declared